May 24, 2026
Standing Up argus
The HP t620 thin client arrived in a box without a storage drive, without an OS, and without a power cord. That’s what used hardware looks like, and it’s also why it cost what it did. Once the missing pieces arrived separately, the plan was to turn it into a dedicated monitoring node: Rocky Linux on bare metal, a full metrics pipeline feeding Grafana dashboards, and eventually a security layer watching everything that crosses the network. This post covers the first half of that: getting Rocky installed, wiring together Prometheus, Grafana, Mosquitto, Telegraf, and node_exporter, and setting up Node-RED to push temperature alerts to a phone.
The Hardware
The t620 is a small-form-factor thin client from HP. 4GB RAM, no moving parts, passive cooling. For a monitoring node that runs continuously and does no heavy lifting, it’s close to ideal. The M.2 slot on the motherboard is SATA only, not NVMe. That distinction matters when ordering a drive; an NVMe M.2 will physically fit but the t620 won’t see it. One additional hardware note: the M.2 retaining screw is HP’s proprietary M1.6 Torx, not the standard M2 used by every screw kit in circulation. Tape held the drive seated long enough to complete the install while the right screw was tracked down.
Getting Rocky On It
Rocky Linux 9.5, minimal install. The bootable USB was written with Rufus on quantum in DD mode. ISO mode produces a USB that some BIOS implementations won’t recognize. HP thin clients use F10 for the boot menu. The USB wasn’t surfacing under UEFI boot sources because Rufus wrote it in MBR/Legacy mode, so Legacy boot had to be enabled and the USB moved above the M.2 in the boot order before the Anaconda installer would launch.
Anaconda minimal, auto-partitioned. The internal M.2 handles the OS. An external 500GB SSD mounted at /mnt/data is where all service data lives. If the OS ever needs to be wiped and reinstalled, the stack’s data survives untouched. The external drive is UUID-pinned in /etc/fstab, not mounted by device path, which can shift. That entry was verified before anything else was installed.
Post-install baseline: hostname set to argus, static IP 192.168.10.150 on enp1s0, SSH key auth from quantum, EPEL enabled, dnf update run. SELinux left enforcing throughout.
One Rocky-specific thing: after the first reboot post-install, argus came up with no IP address on enp1s0. The static IP configured during the Anaconda install hadn’t persisted. The NetworkManager connection profile existed but had no autoconnect flag and no IP written to it. The fix is nmcli connection modify rather than ip addr add; the former writes to the profile on disk and survives reboots, the latter doesn’t:
sudo nmcli connection modify enp1s0 \
  ipv4.addresses 192.168.10.150/24 \
  ipv4.gateway 192.168.10.1 \
  ipv4.dns 192.168.10.111 \
  ipv4.method manual \
  connection.autoconnect yes

sudo nmcli connection up enp1s0
Confirmed persistent across two reboots before moving on.
The Data Directory Convention
Before installing any service, the directory structure goes in first:
sudo mkdir -p /mnt/data/{prometheus,grafana,loki,mosquitto/{data,log},telegraf}
Every service is configured to write its data to /mnt/data from day one. This keeps the OS partition clean and makes the monitoring stack effectively portable. The OS is disposable; the data isn’t.
Prometheus
Prometheus isn’t in the Rocky repos, so it’s a binary install from upstream. Version 3.5.3 LTS. System user, systemd unit, 30-day retention, data at /mnt/data/prometheus, port 9090.
Prometheus 3.x no longer ships consoles/ or console_libraries/ directories. Any install step that copies those can be skipped.
Grafana
Official RPM repo. Port 3000, data at /mnt/data/grafana. Prometheus added as a data source and confirmed green. Dashboard 1860 (Node Exporter Full) imported from grafana.com. Once node_exporter is running on both hosts, both argus and thing appear in the instance dropdown without any additional configuration.

node_exporter
Installed on both argus and thing. On thing, a ufw rule scopes access to 192.168.10.0/24:9100. Host metrics don’t need to be reachable from anywhere else. Both targets confirmed green in the Prometheus targets view.
Mosquitto
Available via EPEL. Version 2.0.22. Two problems each produced a silent wrong answer rather than a useful error.
Mosquitto binds to localhost only by default. Remote connections require an explicit listener configuration, and the right way to add it is a drop-in file via include_dir in mosquitto.conf, not an edit to the main config, which gets overwritten on package updates:
# /etc/mosquitto/conf.d/listener.conf
listener 1883
allow_anonymous false
password_file /etc/mosquitto/passwd
The passwd file needs to be owned by mosquitto:mosquitto. If it’s owned by root:root, authentication fails without a useful error message. journalctl -u mosquitto is what makes the actual problem visible.
Port 1883, persistence and logs to /mnt/data/mosquitto, no anonymous connections.
One more: Mosquitto passwords can’t contain ! when set via shell commands. The shell interprets it as a history expansion event even inside single quotes. Use a different character.
Telegraf
InfluxData repo. Version 1.38.3. The correct GPG key is influxdata-archive.key, not influxdata-archive_compat.key. The _compat variant causes a silent install failure: dnf install exits cleanly but the package isn’t actually there. Running telegraf --version after install is the right verification step.
Telegraf is configured as an MQTT consumer on labnet/sensors/# and exposes a Prometheus-format metrics endpoint on port 9273. Adding it to the Prometheus scrape config:
- job_name: 'telegraf'
  static_configs:
    - targets: ['192.168.10.150:9273']
Both the argus node_exporter target and the Telegraf target confirmed green at http://192.168.10.150:9090/targets.
Node-RED and the Alert Flow
Node-RED v4.1.8, native install, not Docker. Port 1880, data at /mnt/data/nodered. The use case is simple: watch the temperature feed from env-node-01 and send a notification when it goes outside an acceptable range.
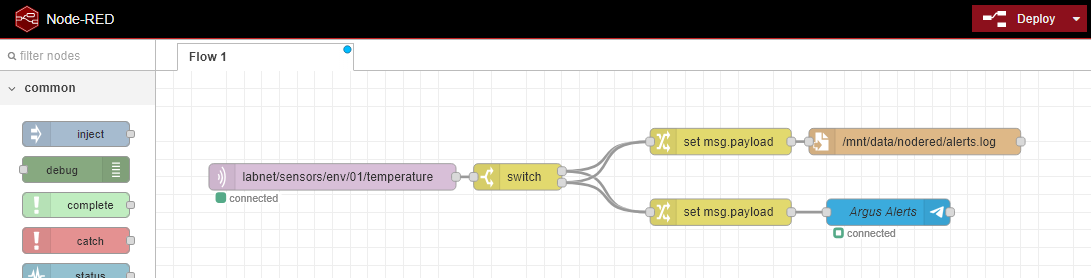
The flow: an MQTT In node subscribes to labnet/sensors/env/01/temperature. A switch node checks whether the value is above 80°F or at or below 60°F. Two parallel branches run off the switch. One formats a timestamped log entry and appends it to /mnt/data/nodered/alerts.log. The other formats a Telegram message payload and sends it to the Argus Alerts bot via node-red-contrib-telegrambot. The branching happens directly off the switch, not off one branch feeding into the other. Clean separation, and easy to add more notification channels later by adding another branch.
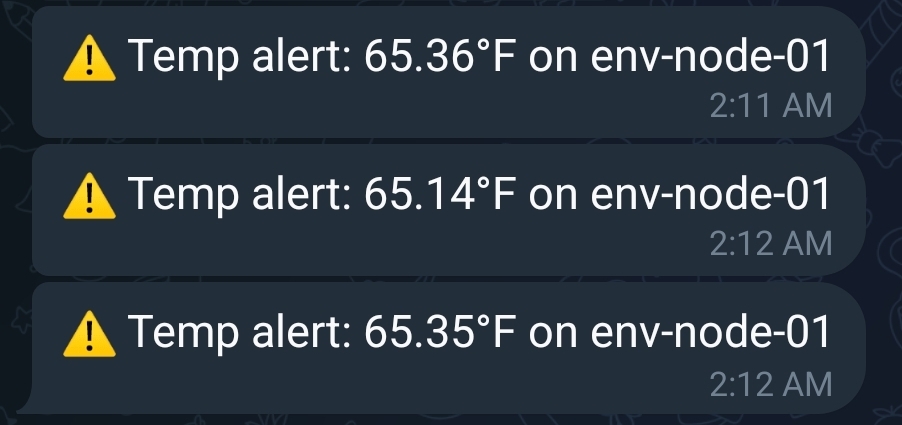
Setting up the Telegram bot takes about two minutes via BotFather. Get a token, get a chat ID, drop both into the Telegram sender node. The full pipeline confirmed end to end:
2026-05-02T05:36:58.124Z | labnet/sensors/env/01/temperature | {"device":"env-node-01","celsius":18.59,"fahrenheit":65.46,"rssi":-39}
What Came Out of Building It
Two failures had the same shape: the service starts, the install looks clean, but something is silently wrong. The Telegraf GPG key produced an apparent success from dnf with no actual package installed. The Mosquitto passwd ownership issue let the broker start and accept connections while rejecting all authentication without logging anything useful. In both cases journalctl was the tool that made the problem visible, not the install output.
The Node-RED alert architecture came out of a debugging session where the Telegram message wasn’t sending when the log branch ran correctly. Downstream nodes in a flow shouldn’t depend on upstream side effects. Independent branches are more reliable and easier to extend.
Where This Is Going
argus is running and the full metrics pipeline is confirmed: sensor data from the ESP32 flowing through MQTT, Telegraf, Prometheus, and into Grafana dashboards, with Node-RED pushing threshold alerts to a phone. The next post adds the security layer: Zeek, Suricata, Fluent Bit, and Loki, putting the capture0 interface that’s been live since Post 3 to actual use.