May 26, 2026
Watching the Wire: Zeek, Suricata, and a Log Pipeline on argus
capture0 has been live since Post 3. The SPAN session on the Catalyst is copying everything that crosses Fa0/1 to Fa0/2, and the USB NIC on argus is receiving it. Up until now, tcpdump was the only thing listening. This post adds the actual security layer: Zeek parsing that traffic into structured logs, Suricata running 50,000 rules against it, Fluent Bit shipping those logs to Loki, and Grafana making all of it queryable alongside the host metrics already in place.
Why Both Zeek and Suricata
They answer different questions. Suricata is signature-based: it fires when traffic matches a known bad pattern. Zeek doesn’t alert; it structures everything it sees into typed log files. Connection metadata, DNS queries, HTTP transactions, MQTT publishes, SSL handshakes – all parsed and written whether or not anything looks suspicious. Zeek tells you what happened. Suricata tells you when something matched a rule. Together they cover both angles: reactive alerting and the structured history needed to investigate it.
Zeek
Zeek LTS has no native RPM for Rocky Linux 9. The upstream OBS project dropped RHEL support. Docker is the correct path.
sudo docker run -d \
  --name zeek \
  --network host \
  --cap-add NET_RAW \
  --cap-add NET_ADMIN \
  --restart unless-stopped \
  -v /mnt/data/zeek/logs:/zeek-logs \
  zeek/zeek:lts \
  zeek -i capture0 -C -e 'redef Log::default_logdir="/zeek-logs";'
--network host is required: Zeek needs direct access to the physical interface. NET_RAW and NET_ADMIN capabilities are needed for packet capture. Logs write to /mnt/data/zeek/logs on the host via the volume mount.
A bare docker run doesn’t survive a reboot. A systemd unit at /etc/systemd/system/zeek.service wraps the container so it starts automatically:
[Unit]
Description=Zeek Network Security Monitor
After=docker.service
Requires=docker.service

[Service]
Restart=always
ExecStart=/usr/bin/docker start -a zeek
ExecStop=/usr/bin/docker stop zeek

[Install]
WantedBy=multi-user.target
Zeek LTS writes a telemetry.log file that can’t be suppressed via config in this version. Left alone it grows without bound. An hourly cron at /etc/cron.d/zeek-cleanup handles it:
0 * * * * root rm -f /mnt/data/zeek/logs/telemetry.log
Not elegant, but it works. The logs that matter aren’t affected.
Confirmed writing after startup: conn.log, dns.log, http.log, ssl.log, and mqtt_publish.log. That last one is worth highlighting: Zeek is parsing MQTT at the protocol level, which means sensor traffic from env-node-01 on labnet is showing up as structured log entries, not just raw packet captures.

Suricata
Available natively via EPEL. Version 7.0.13.
sudo dnf install -y suricata
The default systemd unit passes the interface via command line, but the EPEL package’s unit file doesn’t expose an easy override. The right approach is a systemd drop-in rather than editing the unit file directly. Drop-ins survive package updates:
# /etc/systemd/system/suricata.service.d/override.conf
[Service]
ExecStart=
ExecStart=/usr/sbin/suricata -c /etc/suricata/suricata.yaml -i capture0
Logs go to /mnt/data/suricata, which needs to be owned by the suricata user. Confirmed writing: eve.json, fast.log, stats.log.
Rules via suricata-update:
sudo suricata-update
50,225 rules loaded from the default ruleset. To keep them fresh, a daily cron at 2 AM pulls updates and hot-reloads them into the running process:
0 2 * * * root /usr/bin/suricata-update && /usr/bin/suricatasc -c reload-rules
The hot-reload matters. Restarting Suricata to update rules drops traffic during the restart window. suricatasc -c reload-rules tells the running process to swap in the new ruleset without stopping, communicating over a Unix socket at /var/run/suricata/suricata-command.socket. Confirm the socket is active before relying on the cron: sudo suricatasc -c version should return a response. If the socket isn’t there, the reload half of the cron silently fails and rules only update on next restart.
Fluent Bit
Fluent Bit collects the Zeek and Suricata logs and ships them to Loki. Available via EPEL. Version 4.2.2, native systemd.
Config at /etc/fluent-bit/fluent-bit.conf:
[SERVICE]
    Flush         5
    Daemon        Off
    Log_Level     info
    Parsers_File  parsers.conf

[INPUT]
    Name              tail
    Tag               zeek.conn
    Path              /mnt/data/zeek/logs/conn.log
    Parser            json
    Refresh_Interval  5
    Skip_Long_Lines   On

[INPUT]
    Name              tail
    Tag               zeek.dns
    Path              /mnt/data/zeek/logs/dns.log
    Parser            json
    Refresh_Interval  5
    Skip_Long_Lines   On

[INPUT]
    Name              tail
    Tag               zeek.mqtt
    Path              /mnt/data/zeek/logs/mqtt_publish.log
    Parser            json
    Refresh_Interval  5
    Skip_Long_Lines   On

[INPUT]
    Name              tail
    Tag               suricata
    Path              /mnt/data/suricata/eve.json
    Parser            json
    Refresh_Interval  5
    Skip_Long_Lines   On

[OUTPUT]
    Name            loki
    Match           zeek.*
    Host            127.0.0.1
    Port            3100
    Labels          job=zeek
    Label_Keys      $tag

[OUTPUT]
    Name            loki
    Match           suricata
    Host            127.0.0.1
    Port            3100
    Labels          job=suricata
Three Zeek logs (conn.log, dns.log, mqtt_publish.log) tagged zeek.*, and Suricata’s eve.json tagged suricata. Each input uses the json parser and a 5-second refresh interval, with Skip_Long_Lines on to handle Zeek’s occasionally wide log lines. Two separate OUTPUT blocks ship to Loki on localhost: one matching zeek.* with a job=zeek label, one matching suricata with job=suricata. Keeping them separate means Grafana queries can filter cleanly by source.
Loki
No native Rocky 9 RPM. Docker, grafana/loki:latest. Config at /mnt/data/loki/loki-config.yaml, data at /mnt/data/loki, port 3100.
sudo docker run -d \
  --name loki \
  --network host \
  --restart unless-stopped \
  -v /mnt/data/loki:/mnt/loki \
  -v /mnt/data/loki/loki-config.yaml:/etc/loki/config.yaml \
  grafana/loki:latest \
  -config.file=/etc/loki/config.yaml
Added as a Grafana data source pointing at http://127.0.0.1:3100, confirmed green. Zeek MQTT data immediately queryable in Grafana Explore:
{job="zeek.mqtt"}
The Dashboard
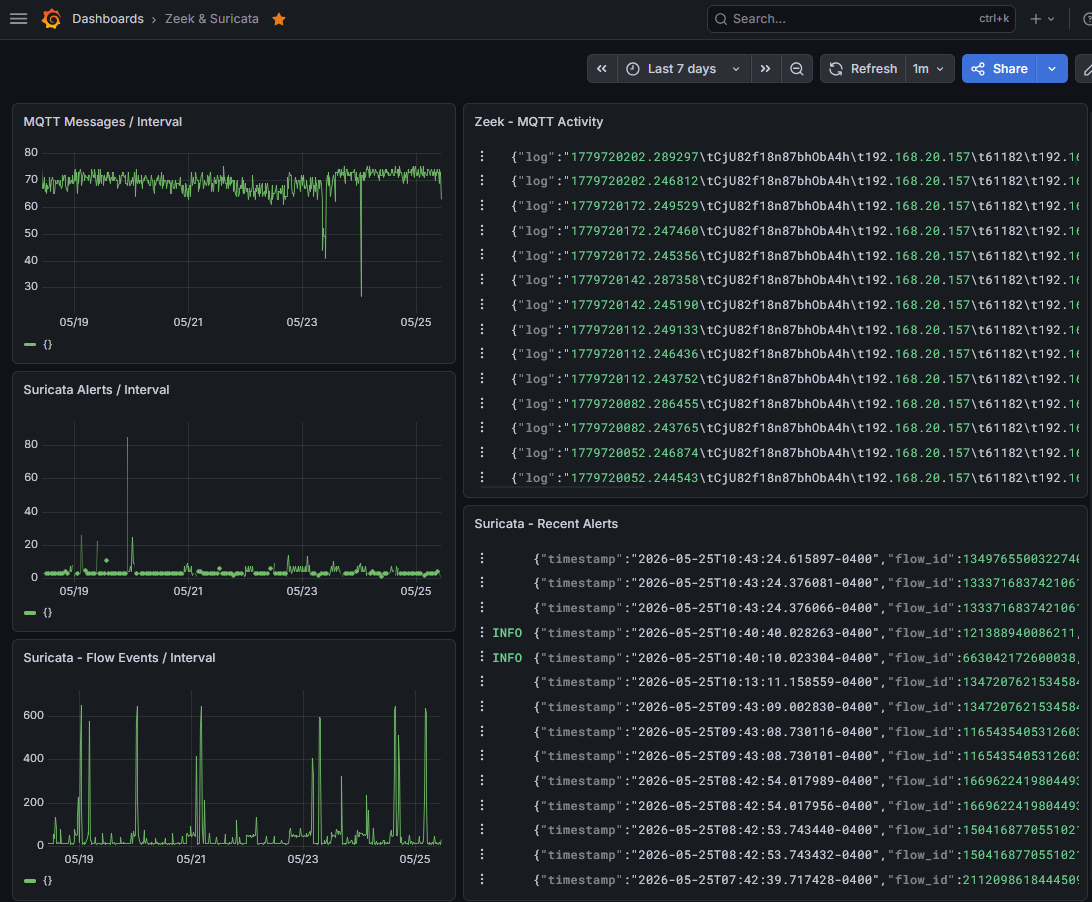
Five panels, two columns. Left column: time series charts showing rates over time, covering MQTT Messages / Interval, Suricata Alerts / Interval, and Suricata Flow Events / Interval. Right column: log tables showing raw entries for Zeek MQTT Activity and Suricata Recent Alerts. The pairing is deliberate: the rate graphs show the shape of activity over time, the log tables give you the actual events when something warrants a closer look.
The Zeek MQTT panel is showing raw Fluent Bit log lines rather than parsed fields. The labnet/sensors topic is visible in each entry and the full structured content is there. Presentation polish is a future item. The data is queryable; that’s what matters at this stage.
Dashboard named “Zeek & Suricata”, 1-minute refresh, favorited.
What Came Out of Building It
The Zeek and Suricata installs were each straightforward once the right deployment path was clear: Docker for Zeek, native EPEL for Suricata. The friction in this post was almost entirely in the plumbing: getting Fluent Bit configured correctly, making sure Loki was reachable, confirming data was flowing through each stage before moving to the next.
The suricatasc hot-reload is worth understanding even if the implementation is a one-line cron entry. On a sensor that runs continuously, restarting the process to update rules creates a gap. The Unix socket approach eliminates that gap.
Where This Is Going
The full stack on argus is operational. Metrics, logs, alerts, and network visibility all feed into Grafana from a thin client that cost less than a tank of gas. The next post puts the VLAN isolation to work: ESP32 sensor nodes joining labnet, and the security layer watching what they do.